


翘嘴鲌(Culter alburnus)俗称白鱼、翘嘴白丝、大白鱼,隶属鲤形目(Cypriniformes)、鲤科(Cyprinidae)、鲌亚科(Culterinae)、鲌属(Culter),是鲌亚科中最大的一种鱼类,广泛分布于我国各水系[1]。翘嘴鲌是中国四大名鱼之一,其生长迅速、肉味鲜美、肉质细嫩洁白、营养丰富、经济价值较高,已成为我国常见的淡水养殖品种[2-3]。翘嘴鲌为凶猛肉食性鱼类,是水域生态系统中的顶级消费者,能有效控制小型鱼类种群数量,减轻小型鱼类对浮游生物的压力,在水域生态系统中发挥重要的调控作用[4-5]。多年来,由于环境污染、酷渔滥捕及栖息地破坏,野生翘嘴鲌资源遭到严重破坏,其种群数量急剧衰退,个体小型化、低龄化趋势严重,恢复翘嘴鲌种质资源成为亟待解决的问题[6-7]。
太湖和洪泽湖分别是中国第三、第四大淡水湖泊,分属于长江水系和淮河水系。翘嘴鲌是太湖、洪泽湖常见的鱼类和重要的经济物种,但有关两湖泊群体的遗传结构尚缺乏认识。本研究采集太湖和洪泽湖翘嘴鲌,采用线粒体Cyt b基因序列作为分子标记,探究太湖和洪泽湖翘嘴鲌群体遗传多样性和遗传结构,以期为翘嘴鲌种质资源的科学保护、合理利用及增殖放流提供科学依据。
1 材料和方法
1.1 实验材料
于2021年采用三重刺网在太湖和洪泽湖采集翘嘴鲌样本,其中太湖(Tai Lake,TL)群体48尾,洪泽湖(Hongze Lake,HZL)群体50尾。经测量和称重,太湖群体的平均体长和体质量分别为36.9 cm和682.3 g,洪泽湖群体的平均体长和体质量分别为34.0 cm和473.2 g。剪取翘嘴鲌肌肉组织置于无水乙醇中保存,带回实验室备用。
1.2 DNA提取、PCR扩增和测序
取适量肌肉组织用于提取基因组DNA。采用TaKaRa公司试剂盒提取翘嘴鲌的基因组DNA,再将DNA溶于超纯水,置于-20℃保存备用。采用琼脂糖凝集电泳检测DNA完整性,并测定DNA的浓度和纯度。
Cyt b基因扩增的引物为L14724和H15915[17],引物由生工生物工程(上海)股份有限公司合成。PCR反应体系总体积为50 μL,其中包括2×Taq PCR Master Mix 25 μL,正、反向引物各2 μL (10 μmol/L),DNA模板2 μL,ddH2O 19 μL。PCR条件:94℃ 4 min;94℃ 40 s,55℃ 40 s,72℃ 90 s,循环30次;72℃ 10 min。
采用琼脂糖凝胶电泳对PCR产物进行检测,检测合格的PCR产物送至生工生物工程(上海)股份有限公司进行双向测序,测序引物与扩增引物一致。
1.3 序列处理和分析
采用BioEdit 7.0软件[18]和ClustalX 1.83软件[19]对序列进行编辑、校对和多重比对。采用DNASP 5.0软件[20]计算遗传多样性参数:变异位点(Polymorphic sites,S)、单倍型数目(Haplotype number,N)、单倍型多样性指数(Haplotye diversity index,Hd)、核苷酸多样性指数(Nucleotide diversity index,Pi)和平均核苷酸差异数(Average number of nucleotide differences,K)。采用MEGA 7.0软件[21]统计序列碱基组成,计算群体间的Kimura双参数遗传距离,利用邻接法(Neighbor-joining method,NJ)构建单倍型系统进化树。采用Arlequin 3.5软件[22]进行分子方差分析(AMOVA),计算群体遗传变异来源、变异方差和遗传分化指数;同时进行Tajima's D和Fu's Fs中性检验和核苷酸错配分析,推测群体历史动态。
2 结果与分析
2.1 翘嘴鲌Cyt b序列变异和遗传多样性
通过PCR扩增和测序,获得98条Cyt b基因全序列。结果显示,翘嘴鲌Cyt b基因序列全长为1 141 bp。Cyt b序列共有29个变异位点,变异率为2.54%,有单一信息位点11个,简约信息位点18个。98条Cyt b序列碱基平均含量分别为A(29.3%)、T(26.6%)、C(29.4%)和G(14.7%),碱基A+T的含量(55.9%)大于C+G的含量(44.1%),呈现出明显的碱基组成偏倚性。4种碱基的密码子使用频率有明显差异,第一位点密码子4种碱基含量近似;第二位点密码子T含量最大,G含量最小;第三位点密码子A含量最大,G含量最小(表1)。
表1 Cyt b基因序列碱基组成
Tab.1
| 密码子位点 Condon site | 碱基含量百分比/% The percentage of base content | |||
|---|---|---|---|---|
| A | T | C | G | |
| 第一位点 First site | 24.7 | 24.2 | 25.1 | 26.0 |
| 第二位点 Second site | 20.3 | 41.1 | 25.5 | 13.2 |
| 第三位点Third site | 43.1 | 14.6 | 37.5 | 4.8 |
| 平均值 Average value | 29.3 | 26.6 | 29.4 | 14.7 |
98尾翘嘴鲌共定义29种单倍型(H1~H29),平均Hd和Pi分别为0.923和0.002 74,平均核苷酸差异数为3.127。太湖和洪泽湖群体Hd分别为0.927和0.816,Pi分别为0.028 5和0.002 20,太湖群体的遗传多样性高于洪泽湖群体,但两者都具有高Hd、低Pi的特点。太湖群体和洪泽湖群体分别有20种和14种单倍型,其中共享单倍型有5种(H1、H2、H4、H6和H24),其他单倍型则为两个群体所独有。单倍型H2、H4和H20是群体中的优势单倍型,个体数量分别有10个、10个和20个(表2)。
表2 两个翘嘴鲌群体的遗传多样性
Tab.2
| 群体 Population | 样本量 N | 变异位点 S | 单倍型(数量) Haplotypes(number) | 单倍型 多样性 指数 Hd | 核苷酸 多样性 指数 Pi | 平均核苷 酸差异数 K |
|---|---|---|---|---|---|---|
| 太湖 TL | 48 | 22 | H1(1)、H2(9)、H3(1)、H4(3)、H5(1)、H6(4)、H7(2)、H8(1)、H9(3)、H10(1)、H11(1)、H14(1)、H16(1)、H17(1)、H23(4)、H24(4)、H25(1)、 H27(1)、H28(1)、H29(7) | 0.927 | 0.002 85 | 3.250 |
| 洪泽湖 HZL | 50 | 18 | H1(2)、H2(1)、H4(5)、H6(2)、H12(1)、H13(3)、 H15(2)、H18(2)、H19(20)、H20(1)、H21(1)、H22(3)、H24(6)、H26(1) | 0.816 | 0.002 20 | 2.508 |
| 总体Total | 98 | 29 | - | 0.923 | 0.002 74 | 3.127 |
2.2 群体遗传结构
分子方差分析结果显示,群体间的遗传变异占比为15.01%,群体内的遗传变异占比为84.99%。两群体间的遗传分化系数为0.150 15,且统计具有极显著性差异(P<0.01),表明两群体有极显著的遗传分化(表3)。
表3 两个翘嘴鲌群体的分子方差分析
Tab.3
| 差异来源 Source of variation | 自由度 df | 变异组分 Variance components | 变异百分比 Percentage of variation | 遗传分化系数 Fst |
|---|---|---|---|---|
| 群体间 Among populations | 1 | 0.253 63 Va | 15.01 | 0.150 15** |
| 群体内Within populations | 96 | 1.435 57 Vb | 84.99 | |
| 总计Total | 97 | 1.689 21 | 100 |
注:**表示有极显著差异(P<0.01)。
Note:** indicated extremely significant difference(P<0.01).
2.3 单倍型聚类分析
采用MEGA 7.0软件计算翘嘴鲌单倍型之间的Kimura双参数遗传距离,结果显示,单倍型之间的遗传距离较小,变幅仅为0.000 877~0.007 06,均值为0.003 35。以蒙古鲌(Culter mongolicus,GenBank:AP009060.1)作为外类群,采用NJ法构建14个单倍型的系统进化树(图1)。结果显示,所有单倍型聚为一个大的进化支,两群体的单倍型混杂分布,暗示两群体间存在一定程度的基因交流,并没有形成与地理位置相对应的遗传结构。
图1
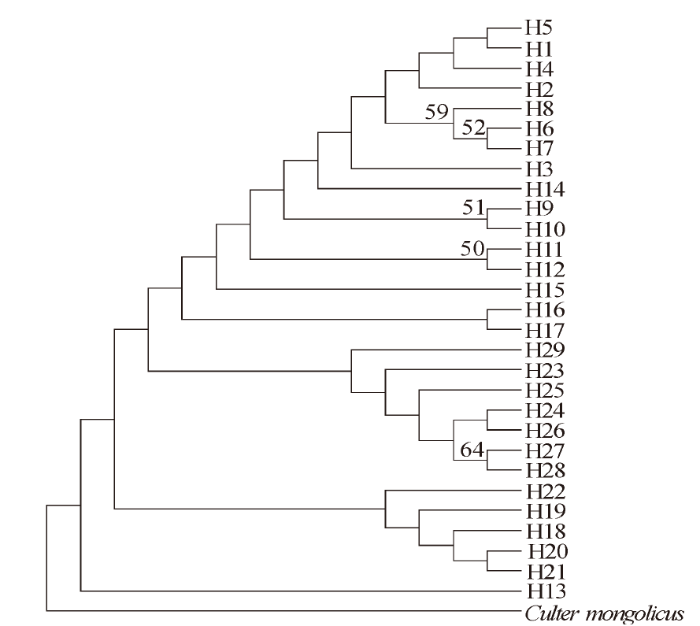
图1
基于 Cyt b 序列的翘嘴鲌单倍型NJ系统树
Fig.1
The NJ phylogenetic tree of C.alburnus haplotypes based on Cyt b sequences
2.4 群体历史动态
表4 两个翘嘴鲌群体的中性检验结果
Tab.4
| 群体 Populations | 中性检验 Neutral test | |||
|---|---|---|---|---|
| Tajima's D | P | Fu's Fs | P | |
| 太湖群体 TL | -1.117 73 | 0.113 00 | -9.403 80 | 0.000 00 |
| 洪泽湖群 体HZL | -1.183 05 | 0.104 00 | -4.308 53 | 0.036 00 |
| 总体Total | -1.348 72 | 0.061 00 | -16.589 12 | 0.000 00 |
图2
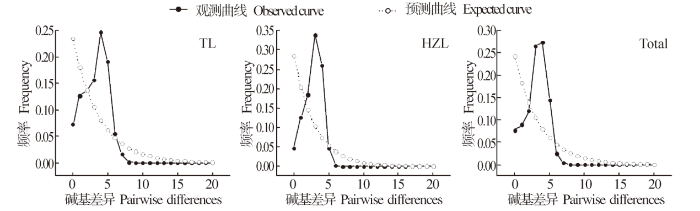
图2
两个翘嘴鲌群体的歧点分布曲线
Fig.2
The mismatch distribution of two C.alburnus poulations
3 讨论
3.1 翘嘴鲌遗传多样性
遗传多样性是生物进化和适应环境的基础, Hd和Pi是评价群体mtDNA变异程度的主要指标,Hd和Pi越大,表明群体的遗传多样性越丰富[23]。相比较而言,核苷酸多态性考虑各种mtDNA单倍型在群体中所占的比例,因而更能精确反映群体的mtDNA多态程度[24]。当Pi值在0.001 5~0.004 7时,表明遗传多样性处于较低水平[25]。本研究结果显示,太湖群体的Hd和Pi分别为 0.927和0.002 85,洪泽湖群体的Hd和Pi分别为0.816和0.002 20,表明两个湖泊翘嘴鲌群体的遗传多样性均较低。一方面,受过度捕捞、环境污染、栖息地破坏等多种进化压力的影响,翘嘴鲌种群数量减少和基因多样性降低[26⇓-28];另一方面,近年来开展的翘嘴鲌人工增殖放流,使大量放流群体进入太湖和洪泽湖,由于近亲杂交和遗传漂变等因素的影响,放流群体通常会丢失某些位点等位基因,致使遗传多样性普遍低于野生群体[29-30]。整体来看,翘嘴鲌的Hd和Pi分别为0.923和0.002 74。根据Grant W A S等提出的鱼类遗传多样性大小标准(Hd:0.5,Pi:0.005)[31],表明翘嘴鲌遗传多样性呈现出高Hd、低Pi的特点。已有研究结果显示:6个湖泊或水库)(兴凯湖、南湾水库、太湖、梁子湖、浮桥河水库、三溪口水库)群体(Hd:0.605,Pi:0.001 63)[32]、6个湖泊(兴凯湖、太湖、微山湖、洪泽湖、巢湖、洞庭湖)群体(Hd:0.915 0,Pi:0.002 60)[26]、长江水系14个群体(Hd:0.866,Pi:0.003 30)[27]、珠江流域群体(Hd:0.873 6,Pi:0.008 93)[33]及滆湖群体(Hd:0.907,Pi:0.002 4)[34],表明我国各水系及地理群体遗传多样性均呈现高Hd、低Pi共存现象,也指示翘嘴鲌种质资源遗传多样性较低是一个普遍现象[26⇓-28,32⇓-34]。
另外,鱼类的遗传多样性模式与其进化历史密切相关,当Hd≥0.5、Pi<0.005时,认为是受瓶颈效应影响后种群数量的迅速扩张而导致,因核苷酸多样性的积累时间比单倍型多样性更漫长得多,从而形成高Hd、低Pi模式[31]。通常利用中性检测和歧点分布曲线推测群体的历史动态,若Fu's Fs和Tajima's D检验结果为负值且具有显著性差异,歧点分布曲线呈单峰型,则说明序列中含有比中性进化模型更多的核苷酸位点变化,可能预示种群经历过一个扩张的历史[35-36]。本研究结果显示,翘嘴鲌太湖和洪泽湖群体的Fu's Fs和Tajima's D中性检测结果均为负值,Fu's Fs统计检验具有极显著性差异(表4),且核苷酸歧点分布曲线具有典型的单峰型(图2),表明翘嘴鲌在历史上经历过群体扩张事件[28],形成了高Hd、低Pi的遗传多样性模式。
3.2 翘嘴鲌遗传结构
通常用遗传分化系数Fst来反映各群体间遗传分化程度,若Fst值在0~0.05之间,表示各群体间不存在分化;若Fst值在0.05~0.15之间,表示各群体间存在中度分化;若Fst值在0.15~0.25之间,表示各群体间存在高度分化[37]。本研究结果显示,太湖和洪泽湖群体间的Fst值为0.150 15 (P<0.01),表明两群体间有极显著的高度遗传分化。从群体单倍型组成来看,两群体拥有5个共享单倍型,太湖和洪泽湖群体分别拥有15个和9个特有单倍型,特有单倍型占比为82.8%,共享单倍型占比为17.2%,表明两群体间基因交流较弱,已经出现遗传分化。已有研究表明,基于线粒体ND2序列的太湖和洪泽湖翘嘴鲌群体间Fst值为0.136 05(P<0.01),显示两群体间有极显著的中度遗传分化[27],与本研究结果类似。一般来说,地理隔离是导致群体间出现遗传分化的重要因素。太湖属于长江水系,洪泽湖属于淮河水系,因修闸建坝及生态环境差异导致群体间基因交流通道受阻,而产生遗传差异。另外,群体的进化历史也是影响群体遗传结构的重要因素[38]。研究表明,长江水系翘嘴鲌扩张时间距今3万~4万年,为更新世晚期,早于最后一次大冰期[27]。本研究结果显示翘嘴鲌在进化过程中经历过显著的群体扩张事件,因此可以推测,随着最后一次冰期结束,气候变暖,翘嘴鲌可能由其避难所向外扩散后发生重新殖化事件,从而逐渐形成现今的遗传结构模式。
3.3 翘嘴鲌种质资源管理和保护
本研究采用线粒体Cyt b基因序列对太湖和洪泽湖翘嘴鲌群体遗传多样性和遗传结构进行分析,可为翘嘴鲌种质资源保护提供参考依据。研究结果显示,翘嘴鲌群体呈现出高单倍型多样性和低核苷酸多样性共存模式,指示翘嘴鲌遗传多样性较低,需要采取措施以提高翘嘴鲌遗传多样性: 1)控制水体污染,修复栖息环境,为翘嘴鲌生存和繁衍提供良好的生态环境条件; 2)打击非法捕捞,限制捕捞强度,实现翘嘴鲌种群数量恢复性增长; 3)科学开展人工增殖放流,对放流群体和野生群体遗传多样性进行评估,避免人工放流对野生群体遗传多样性和遗传结构造成不利的影响。从遗传结构来看,两湖泊群体间存在高度遗传分化,各群体拥有较多的特有单倍型,因此应将太湖和洪泽湖翘嘴鲌群体分别进行管理和保护。
参考文献
Genetics in fisheries management
[J].
基于Cyt b基因的江苏省湖鲚种群遗传多样性和遗传结构分析
[J].
为了解江苏省湖泊湖鲚种群的遗传背景,科学保护和合理利用湖鲚种质资源。采用线粒体细胞色素b(Cyt b)基因序列,研究江苏省6个湖泊群体共224尾个体的遗传结构及进化历史动态。结果显示,224条序列共检出62个变异位点,定义57种单倍型,单倍型和核苷酸多样性分别为0.783±0.028和0.00260±0.00019。AMOVA显示遗传变异主要来源于群体内部(91.45%)。遗传分化系数F<sub>st</sub>值统计表明,滆湖群体与其他群体之间有高度分化。错配分布和中性检验表明,滆湖群体进化过程中群体大小保持稳定,其他群体则经历了明显的种群扩张,时间大约在0.12百万年前。研究结果表明,江苏省湖鲚群体的遗传多样性较丰富,滆湖群体拥有多个独享单倍型且与其他群体间具有高度的遗传分化,应将滆湖群体与其他群体作为不同的进化显著单元进行管理和利用。
Molecular systematics of Xenocyprinae (Teleostei:Cyprinidae):taxonomy,biogeography,and coevolution of a special group restricted in east Asia
[J].
BioEdit:a usere-friendly biological sequence alignment editor and analysis program for Windows 95/98NT
[J].
The Clustal-X windows interface:flexible strategies for multiple sequence alignment aided by quality analysistools
[J].
DnaSP,DNA polymorphism analyses by the coalescent and other methods
[J].Summary: DnaSP is a software package for the analysis of DNA polymorphism data. Present version introduces several new modules and features which, among other options allow: (1) handling big data sets (∼5 Mb per sequence); (2) conducting a large number of coalescent-based tests by Monte Carlo computer simulations; (3) extensive analyses of the genetic differentiation and gene flow among populations; (4) analysing the evolutionary pattern of preferred and unpreferred codons; (5) generating graphical outputs for an easy visualization of results.
MEGA7:Molecular evolutionary genetics analysis version 7.0 for bigger datasets
[J].We present the latest version of the Molecular Evolutionary Genetics Analysis (M ega ) software, which contains many sophisticated methods and tools for phylogenomics and phylomedicine. In this major upgrade, M ega has been optimized for use on 64-bit computing systems for analyzing larger datasets. Researchers can now explore and analyze tens of thousands of sequences in M ega. The new version also provides an advanced wizard for building timetrees and includes a new functionality to automatically predict gene duplication events in gene family trees. The 64-bit M ega is made available in two interfaces: graphical and command line. The graphical user interface (GUI) is a native Microsoft Windows application that can also be used on Mac OS X. The command line M ega is available as native applications for Windows, Linux, and Mac OS X. They are intended for use in high-throughput and scripted analysis. Both versions are available from www.megasoftware.net free of charge.
Arlequin suite ver 3.5:a new series of programs to perform population genetics analyses under Linux and Windows
[J].We present here a new version of the Arlequin program available under three different forms: a Windows graphical version (Winarl35), a console version of Arlequin (arlecore), and a specific console version to compute summary statistics (arlsumstat). The command-line versions run under both Linux and Windows. The main innovations of the new version include enhanced outputs in XML format, the possibility to embed graphics displaying computation results directly into output files, and the implementation of a new method to detect loci under selection from genome scans. Command-line versions are designed to handle large series of files, and arlsumstat can be used to generate summary statistics from simulated data sets within an Approximate Bayesian Computation framework.© 2010 Blackwell Publishing Ltd.
基于mtDNA COⅠ和Cyt b基因序列对南中国海不同海域波纹唇鱼群体遗传多样性的研究
[J].
The origin and genetic differentiation of native breeds of pigs in south west China:an approach from mitochondrial DNA polymorphism
[J].
Shallow population histories in deep evolutionary lineages of marine fishes:insights from sardines and anchovies and lessons for conservation
[J].
Statistical tests of neutrality of mutations against population growth,hitchhiking and background selection
[J].The main purpose of this article is to present several new statistical tests of neutrality of mutations against a class of alternative models, under which DNA polymorphisms tend to exhibit excesses of rare alleles or young mutations. Another purpose is to study the powers of existing and newly developed tests and to examine the detailed pattern of polymorphisms under population growth, genetic hitchhiking and background selection. It is found that the polymorphic patterns in a DNA sample under logistic population growth and genetic hitchhiking are very similar and that one of the newly developed tests, Fs, is considerably more powerful than existing tests for rejecting the hypothesis of neutrality of mutations. Background selection gives rise to quite different polymorphic patterns than does logistic population growth or genetic hitchhiking, although all of them show excesses of rare alleles or young mutations. We show that Fu and Li's tests are among the most powerful tests against background selection. Implications of these results are discussed.
New measures for assessing model equilibrium and prediction mismatch in species distribution models
[J].
The interpretation of population structure by F-statistics with special regardto systems of mating
[J].
