


罗氏沼虾(Macrobrachium rosenbergii),俗称泰国虾或马来西亚大虾等,原产于东南亚、南亚和西太平洋岛屿,在我国有两大主要产区,包括两广地区和江浙沪一带。因其营养丰富、体型较大、生长速度快,抗病能力强,罗氏沼虾已成为我国主要的淡水养殖虾类[1]。虽然人工育苗技术的突破和养殖技术的提升提高了罗氏沼虾的养殖产量,但是近年来罗氏沼虾的种质退化现象日益凸显,影响了我国罗氏沼虾养殖业的健康可持续发展。因此,需要开展不同地区罗氏沼虾种群的遗传多样性分析,以更好地指导罗氏沼虾养殖生产。
1 材料与方法
1.1 实验材料
上海选育群体(SC):2014年7月采自上海申漕特种水产开发公司养殖基地(上海漕泾镇)。浙江养殖群体(ZJ)来源于2014年7月浙江南太湖种业有限公司。泰国野生群体(TL)采自2014年7月泰国天然水域中。
上海选育群体(SC)和浙江养殖群体(ZJ)各随机采样90尾,泰国野生群体(TL)随机采样雌、雄各15尾,所有样本浸泡于无水乙醇中,带回实验室,-80℃保存备用。
1.2 基因组DNA提取并检测
从3个罗氏沼虾群体中分别随机选取10个样本,共计30个样本,罗氏沼虾基因组DNA的提取主要参考Moore D D等[9]的方法并稍作改进。采用蛋白酶K裂解液消化、酚-氯仿法抽提并纯化DNA、-20℃无水乙醇沉淀的方法提取肌肉组织中的DNA,TE缓冲液稀释后用1%琼脂糖凝胶电泳检测。
1.3 PCR扩增和序列测定
COⅠ基因片段扩增引物为COⅠ-F(5'-ATTGTCACTGCCCACGCATT-3' )、COⅠ-R(5'-TGTTGGTAGAGGATCGGGTC-3' )。所用引物由生工生物工程(上海)股份有限公司合成。PCR扩增产物经1.0% EB-琼脂糖凝胶电泳检测验证,结果符合测序要求,由生工生物工程(上海)股份有限公司进行纯化和测序。
1.4 数据处理与分析
将测得的序列用BioEdit 7.0.5.2进行序列比对,并辅以人工校对,去除两端冗余序列;用DNSP 5.1软件计算群体遗传变异参数:单倍型数量(Number of haplotypes)、单倍型多样性指数(Haplotype diversity index,Hd)、核苷酸多样性指数(Nucleotide diversity index,π)和平均核苷酸差异数(Average number of nucleotide differences,K);用Arlequin 3.1软件统计分子多态性指数,并对群体遗传变异进行分子方差分析(Analysis of molecular variance,AMOVA)和遗传分化系数(Fixation index statistics,Fst)检验。用MEGA 5.0软件中的Kimura双参数模型计算各群体内和群体间遗传距离,并基于遗传距离构建群体间的分子系统进化树。
2 结果与分析
2.1 罗氏沼虾线粒体COⅠ序列特征
对测得的序列采用BioEdit软件进行比对分析,去除两端多余序列,得到458 bp有效长度的序列,并对其进一步分析。在458 bp COⅠ基因序列中,共检测到8个变异位点,并且全部单碱基突变,无碱基颠换,群体间的碱基差异较小。MEGA 5.0软件分析显示,所有样本序列的A、T、C和G碱基含量的平均值分别为26.3%、28.1%、26.1%和19.6%,A+T的含量为54.4%,高于G+C的含量45.7%。3个罗氏沼虾群体中共有4种单倍型,SC群体、ZJ群体和TL群体的基因型种类分别为1、2和3种。
2.2 罗氏沼虾遗传多样性
对3个罗氏沼虾群体的遗传多样性进行分析(表1),结果显示群体SC、ZJ和TL的单倍型多样性指数(Hd)依次为0、0.356和0.733;核苷酸多样性指数最高的是ZJ群体(π=0.005),其次是TL群体(π=0.002),SC群体最低(π=0)。对3个群体的遗传多样性进行Tajima's D中性检验,结果范围为0~1.337,3个群体Tajima's D 的P值均大于0.05,差异不显著,说明COⅠ基因序列核苷酸的变化符合中性突变假说。
表1 3个罗氏沼虾群体遗传变异参数统计
Tab.1
| 群体 Populations | 单倍型多样性指数 (Hd) Haplotype diversity | 核苷酸多样性指数 (π) Nucleotide diversity | 平均核苷酸差异数(K) Average number of nucleotide differences | Tajima's D检验统计量 Tajima's D test statistic | P值 P value |
|---|---|---|---|---|---|
| 上海 SC | 0 | 0 | 0 | 0 | 1.000 |
| 浙江ZJ | 0.356 | 0.005 | 2.489 | 0.025 | 0.531 |
| 泰国TL | 0.733 | 0.002 | 1.000 | 1.337 | 0.943 |
| 均值Mean | 0.363 | 0.003 | 1.163 | 0.454 | 0.825 |
2.3 罗氏沼虾群体遗传分化与遗传距离
用Arlequin 3.1软件进行AMOVA分析,3个罗氏沼虾群体的遗传变异结构和变异来源见表2。AMOVA的分析结果表明,在罗氏沼虾3个群体的遗传结构差异中,有74.5%遗传差异来源于群体间,25.5%遗传差异来源于群体内。群体间的遗传变异明显高于群体内的遗传变异。
表2 3个罗氏沼虾群体间和群体内的分子方差分析(AMOVA)
Tab.2
| 变异来源 Source of variation | 自由度 df | 平方和 Sum of squares | 遗传变异元素 Variance components | 占总变异的百分比/% Percentage of variation |
|---|---|---|---|---|
| 群体间Among population | 2 | 35.133 | 1.699 Va | 74.5 |
| 群体内Within population | 27 | 15.700 | 0.5819 Vb | 25.5 |
| 总计Total | 29 | 50.833 | 2.280 |
3个群体间的遗传分化指数(Fst)和遗传距离结果如表3所示,SC群体与TL群体遗传分化指数最高(Fst=0.925),其次是ZJ群体与TL群体(Fst=0.687),SC群体与ZJ群体的遗传分化指数最低(Fst=0.111);SC群体与ZJ群体的遗传距离较近,约为0.003,而与TL群体的遗传距离较远,约为0.013。
表3 3个罗氏沼虾群体间遗传分化指数和群体遗传距离
Tab.3
| 群体Populations | 上海SC | 浙江ZJ | 泰国TL |
|---|---|---|---|
| 上海SC | - | 0.003 | 0.013 |
| 浙江ZJ | 0.111 | - | 0.011 |
| 泰国TL | 0.925 | 0.687 | - |
注:对角线以下为遗传分化指数(Fst),对角线以上为遗传距离。
Notes:Below the diagonal was fixation index(Fst),above the diagonal was genetic distance.
2.4 基于COⅠ基因序列的罗氏沼虾分子系统树
根据COⅠ基因序列,从GenBank中下载与罗氏沼虾同属不同种的日本沼虾(Macrobrachium nipponense,Mn)(登录号:FM958077)作为外群,采用NJ法和UPMGA法构建系统进化树。由图1可知,2种方法构建的系统进化树趋于一致,沼虾属的2个种聚为两大支:日本沼虾的遗传距离与罗氏沼虾3个群体均明显偏远,单独聚为一支;SC群体与ZJ群体遗传距离最近,首先聚在一起成为一小支,然后再与TL群体聚为另一支。
图 1
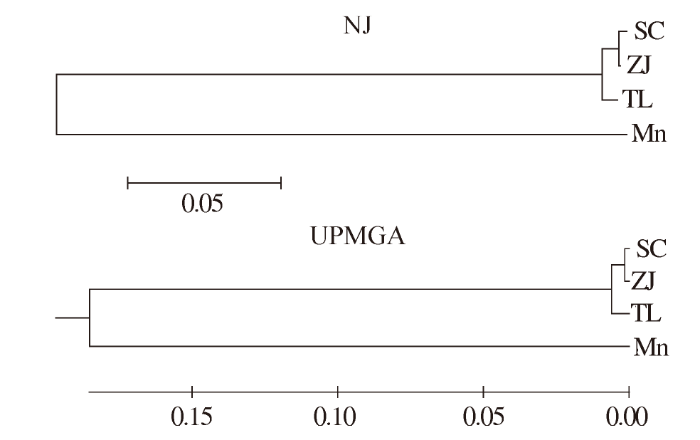
图 1
基于罗氏沼虾COⅠ基因构建的NJ系统树和UPMGA系统树
注:SC、ZJ、TL分别是来自上海、浙江、泰国的罗氏沼虾;Mn为日本沼虾。
Fig.1
NJ and UPMGA phylogenetic tree based on COⅠgene sequences of M. rosenbergii
Notes:SC,ZJ,TL were M.rosenbergii from Shanghai,Zhejiang,Thailand,respectively.Mn was M.nipponense.
3 讨论
3.1 罗氏沼虾线粒体COⅠ序列变异分析
线粒体DNA作为核外遗传物质,普遍存在于真核细胞中,由于具有结构简单、进化速度快、母系遗传、变异性大、核苷酸替代率高等优点[8,10],其已经成为物种鉴定、系统发育以及种群遗传等研究中一种有效的分子标记[11]。mtDNA序列分析是DNA多态性分析技术中重要的方法之一,不论是群体还是个体,任何的遗传变异或者多态都是DNA序列的差异,mtDNA序列分析可以检测到碱基的插入、缺少和替换等变异信息,从而在分子水平上检测个体、群体及种间的多态及遗传差异[12]。COⅠ基因作为mtDNA的主要分子标记之一,适用于种、亚种及地理种群间的系统关系研究[13]。COⅠ序列在虾类的分子系统学中被广泛应用,如Carini G等[14]和 Vassilios K等[15]分别研究了澳洲沼虾(M.australien)的遗传结构和不同地理种群的欧洲龙虾(Homarus gammarus)的系统进化关系。
本研究初步分析了3个罗氏沼虾群体线粒体COⅠ序列的差异,共检测出8个变异位点、4个单倍型。变异位点和单倍型数量少可能是由于各群体样品检测数量偏低或COⅠ基因序列无法将其很好地区分开。但是TL群体的单倍型数量(3个)分别高于SC群体(1个)和ZJ群体(2个)的单倍型数量,这至少可以说明浙江养殖群体和上海选育群体因长期的人工养殖和选育,导致其遗传多样性较野生群体有所降低。碱基组成分析表明,A+T的平均含量(54.4%)高于G+C的平均含量(45.7%),这与许多研究者在其他虾蟹类线粒体基因中检测到的结果类似,如姜虎成等[16]研究发现,淮河水系日本沼虾(Macrobrachium nipponense)A+T的含量(59.0%)高于G+C含量(41.0%);葛家春等[17]研究发现中华绒螯蟹(Eriocheir sinensis)G+C含量(37.6%)低于A+T的含量(62.4%)。
3.2 罗氏沼虾的遗传变异分析
当采用线粒体DNA研究群体遗传多样性时,核苷酸多样性指数(π)和单倍型多样性指数(Hd)均是衡量群体遗传多样性的2个重要指标[18]。有些群体通过变异积累了单倍型的多态性,而并不能积累核苷酸序列的多样化[19]。本研究结果表明,TL群体的单倍型多样性指数较高(Hd=0.733),但其核苷酸多样性指数(π=0.002)明显偏低,说明TL群体可能是由少量个体扩增形成的一个小种群。SC群体和ZJ群体的Hd值和π值均较低,造成这一现象的主要原因可能是这两个群体在长期人工养殖和选育过程中发生了遗传漂变(Genetic drift)、近交(Inbreeding)或奠基者效应(Founder effect)[20-21]。
3.3 罗氏沼虾群体间遗传距离和系统发育分析
Hebert P D N等[24]曾经对动物界的11门13 320个物种的线粒体COⅠ基因进行序列比较分析,得出物种内的遗传距离大部分小于0.010,很少有大于0.020的结论;本研究中,根据罗氏沼虾3个不同群体的遗传距离和系统进化树可以看出,基于线粒体COⅠ基因序列的3个罗氏沼虾群体间的种内遗传距离为0.003~0.013,与其研究结果一致。SC群体与ZJ群体遗传距离最小,为0.003,亲缘关系较近。SC群体和ZJ群体与TL群体的遗传距离分别为0.013和0.011,遗传距离相对较大,亲缘关系也较远。基于遗传距离构建的NJ和UPMGA系统进化树趋于一致,SC群体首先与ZJ群体聚在一起成为一小支,然后再与TL群体聚为另一支,结果表明3个群体的遗传距离进化关系与聚类关系类似。产生这样结果的原因可能是SC群体和ZJ群体的遗传背景相似,而与TL群体遗传背景差异较大,亦或是SC群体、ZJ群体与TL群体存在养殖地理环境的差异。
鉴于本研究是从一个线粒体基因对罗氏沼虾3个不同群体的遗传多样性进行评估,且样本量有限,因此上述结果只可作初步参考,而后期有必要增加检测样本数量,同时将从其他多个线粒体基因并配合核DNA遗传分析,以期得到更全面和客观的结果。
参考文献
池养罗氏沼虾性二型的研究
[J].
取性成熟期罗氏沼虾129尾(其中雌虾65尾,雄虾64尾),测定了额角长、头胸甲长、头胸甲宽、头胸甲高、腹长、体长、全长、第二步足长和体质量等9个性状参数,对雌、雄罗氏沼虾的性二型进行了比较研究。经独立样本t?检验,性成熟雄性体长和体质量均极显著大于雌性(P<0.01),雌、雄罗氏沼虾的头胸甲长、头胸甲宽、头胸甲高、腹长、第二步足长和体长的性二型指数均大于1,说明罗氏沼虾属于雄性大于雌性的虾类。协方差分析结果表明:除了额角长在两性间的差异无统计学意义以外(F=1.279, P=0.260)以外,头胸甲长、头胸甲宽、头胸甲高、腹长和第二步足长在两性间的差异达到了极显著水平(P<0.01)。雄性的头胸甲长、头胸甲宽、头胸甲高和第二步足长随体长的生长速率大于雌性;而腹长随体长的生长速率小于雌性。性选择使得雄性拥有较大的体型和第二步足,以确保其在生殖竞争中可以有效战胜竞争者,提高交配成功率。
Development of polymorphic EST-SSR markers in Macrobrachium rosenbergii by data mining
[J].
Rapid evolution of animal mitochondrial DNA
[J].Mitochondrial DNA was purified from four species of higher primates (Guinea baboon, rhesus macaque, guenon, and human) and digested with 11 restriction endonucleases. A cleavage map was constructed for the mitochondrial DNA of each species. Comparison of the maps, aligned with respect to the origin and direction of DNA replication, revealed that the species differ from one another at most of the cleavage sites. The degree of divergence in nucleotide sequence at these sites was calculated from the fraction of cleavage sites shared by each pair of species. By plotting the degree of divergence in mitochondrial DNA against time of divergence, the rate of base substitution could be calculated from the initial slope of the curve. The value obtained, 0.02 substitutions per base pair per million years, was compared with the value for single-copy nuclear DNA. The rate of evolution of the mitochondrial genome appears to exceed that of the single-copy fraction of the nuclear genome by a factor of about 10. This high rate may be due, in part, to an elevated rate of mutation in mitochondrial DNA. Because of the high rate of evolution, mitochondrial DNA is likely to be an extremely useful molecule to employ for high-resolution analysis of the evolutionary process.
Preparation of genomic DNA from mammalian tissue
[J].
Geographic variation within a tandemly repeated mitochondrial DNA D-loop region of a North American freshwater fish,Pylodictis olivaris
[J].The present study reports the distribution of a 35-bp mitochondrial DNA (mtDNA) D-loop tandemly repeated sequence in the populations of a North American freshwater catfish, Pylodictis olivaris, and the important role of a past geological event in the phylogeographic pattern of this species. A total of 330 individuals of flathead catfish, representing 34 drainages throughout the species' native range in the United States, were collected. While more than 70% of individuals sampled from the Southeastern Gulf Coast drainages were characterized by the presence of a 35-bp mtDNA D-loop tandem repeat proximal to the 5' end, more than 95% of samples from the Mississippi River and its tributaries, as well as from the drainages of the Southwest Gulf Coast region, lack this tandem repeat. Concomitantly, phylogenetic analyses revealed the existence of two distinct matrilineal lineages (lineage I and II) of P. olivaris, which were estimated to have diverged from a common ancestor sometime between 0.70 and 2.05myr ago. While one lineage is comprised of samples from the Mississippi River and its tributaries and rivers draining to the Southwest Gulf Coast, the other lineage is comprised of samples from the Southeastern Gulf Coast drainages. Each lineage also has two sub-lineages, which also showed geographic specificity. Copyright © 2014 Elsevier B.V. All rights reserved.
Population genetics:principle and applications for fisheries scientist
[J].
Genetic population structure of miiuy croaker (Miichthys miiuy) in the Yellow and East China Seas base on mitochondrial COⅠ sequences
[J].
Population structure of Macrobrachium australiense (Decapoda:Palaemonidae)in Western Queensland,Australia:the role of contemporary and historical processes
[J].Rivers of Western Queensland, Australia, represent a discontinuous and variable aquatic habitat for the freshwater fauna of the region. Rivers periodically fluctuate between being highly fragmented, with numerous disconnected waterholes and ephemeral channels, and being highly connected by a dominant system of anastomosing channels. We used mitochondrial sequences to investigate the genetic structure and inferred patterns of dispersal associated with this flow regime for the freshwater prawn, Macrobrachium australiense (Decapoda: Palaemonidae), sampling 28 localities throughout eight catchments. Based on a 505 base pair fragment of mitochondrial cytochrome c oxidase subunit I, we identified 98 haplotypes in a sample of 402 individuals. The haplotypes clustered into two main clades corresponding geographically to the major drainages: the Lake Eyre and Murray-Darling basins. Populations of M. australiense inhabiting the two basins appear to have diverged around 800,000 years ago (estimated sequence divergence of 1.6%). Analysis of population differentiation indicated contemporary high levels of genetic subdivision and restricted gene flow among populations within and among catchments. Phylogenetic analysis detected a series of historical range expansions in the region and we suggest that climate fluctuations during the Pleistocene have resulted in extensive floods that have promoted historical movements of aquatic organisms across catchment boundaries.
Development of mitochondrial DNA primers for use with Homarid Lobsters
[J].DNA primer sets were developed for the amplification of complete mitochondrial genomes for both European and American lobsters in 4 suitable-sized segments. Optimal conditions for polymerase chain reaction routine screening were established. The 4 segments were screened with 24 restriction endonucleases in a test population sample, covering the whole distribution of the European lobster, and restriction patterns of each enzyme were revealed. A segment of 3000 bp comprising part of cytochrome oxidase I gene, the genes cytochrome oxidase II and III, subunits 6 and 8 of ATPase, subunit 3 of the NAD dehydrogenase, and various transfer RNAs, was found to be the most polymorphic. A number of enzyme patterns in each segment differentiated European and American lobsters. Extra bands were observed, indicating heteroplasmy phenomena, which were verified with various approaches. Furthermore, a primer set that enables 1-step ampli fication of the complete mitochondrial genome of the European lobster was established.
基于线粒体D-loop区和COⅠ基因序列研究2个禾花鲤群体和野生鲤群体的遗传多样性与系统进化关系
[J].
Microsatellite and mitochondrial haplotype diversity reveals population differentiation in the tiger shrimp (Penaeus monodon) in the Indo-Pacific region
[J].The black tiger shrimp (Penaeus monodon) is an ecologically and economically important penaeid species and is widely distributed in the Indo-Pacific region. Here we investigated the genetic diversity of P. monodon (n = 355) from eight geographical regions by genotyping at 10 microsatellite loci. The average observed heterozygosity at various loci ranged from 0.638 to 0.743, indicating a high level of genetic variability in this region. Significant departures from Hardy-Weinberg equilibrium caused by heterozygote deficiency were recorded for most loci and populations. Pairwise F(ST) and R(ST) values revealed genetic differentiation among the populations. Evidence from the assignment test showed that the populations in the West Indian Ocean were unique, whereas other populations examined were partially admixed. In addition, the non-metric multidimensional scaling analysis indicated the presence of three geographic groups in the Indo-Pacific region, i.e. the African populations, a population from western Thailand and the remaining populations as a whole. We also sequenced and analysed the mitochondrial control region (mtCR) in these shrimp stocks to determine whether the nuclear and mitochondrial genomes show a similar pattern of genetic differentiation. A total of 262 haplotypes were identified, and nucleotide divergence among haplotypes ranged from 0.2% to 16.3%. Haplotype diversity was high in all populations, with a range from 0.969 to 1. Phylogenetic analysis using the mtCR data revealed that the West Indian Ocean populations were genetically differentiated from the West Pacific populations, consistent with the microsatellite data. These results should have implications for aquaculture management and conservation of aquatic diversity.
Effects of population bottlenecks on genetic diversity as measured by allozyme electrophoresis
[J].
The estimation of population differentiation with microsatellite markers
[J].Microsatellite markers are routinely used to investigate the genetic structuring of natural populations. The knowledge of how genetic variation is partitioned among populations may have important implications not only in evolutionary biology and ecology, but also in conservation biology. Hence, reliable estimates of population differentiation are crucial to understand the connectivity among populations and represent important tools to develop conservation strategies. The estimation of differentiation is c from Wright's FST and/or Slatkin's RST, an FST -analogue assuming a stepwise mutation model. Both these statistics have their drawbacks. Furthermore, there is no clear consensus over their relative accuracy. In this review, we first discuss the consequences of different temporal and spatial sampling strategies on differentiation estimation. Then, we move to statistical problems directly associated with the estimation of population structuring itself, with particular emphasis on the effects of high mutation rates and mutation patterns of microsatellite loci. Finally, we discuss the biological interpretation of population structuring estimates.
